OMG, We’ve Broken the Economy, but it might be OK.
Recession Looms Large
Stagflation remains the dominant theme in financial markets. Recession indicators flash red while inflation measures remain stubbornly high, albeit showing signs of moderation. As we move into the second half of 2022, the narrative will shift from “OMG, inflation” to “OMG, we’ve broken the economy”. The question remains whether the recession we get is priced in or not.
US GDP
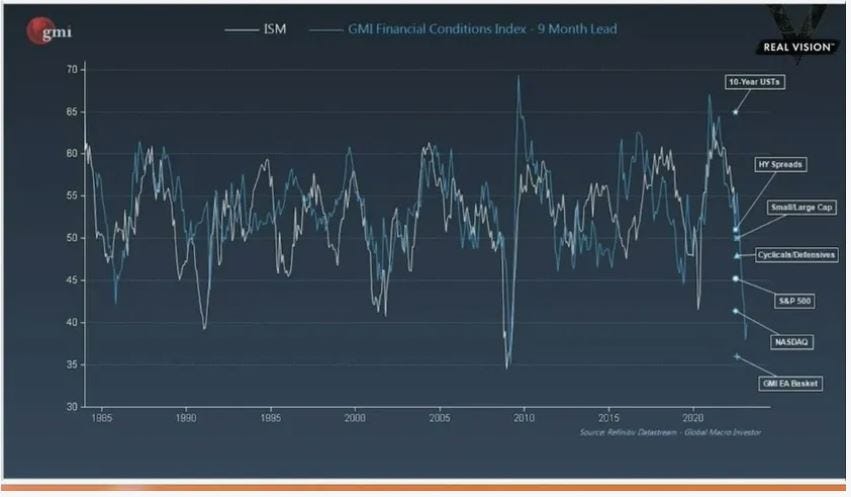
This week will see US GDP numbers for Q2 (April through June). The Atlanta Fed’s GDPNow estimator has a -1.6% annualised real rate. Meanwhile, jobless claims continue their upward trend, indicating a softer US labour market. The GMI financial conditions index (below) provides a good 9-month lagged fit to the ISM, indicating a bottoming of US GDP by March 2023 lower than March 2020 and more in line with 1992, 2001 and 2009.
Tail Wags the Dog
The US economy is highly financialised. When financial assets values fall, it directly contributes to weaker economic growth via softer consumer and business confidence and lower tax revenues. Last year US household net worth reached 6.2x GDP, compared to previous peaks of 4.9x in 2007 and 4.4x in 2000. Stock and bond market weakness year to date has materially dented this ratio.
Financial Repression
Short-term interest rates have spent most of the past decade below the rate of inflation. An environment of high inflation yet low-interest rates is consistent with the “inflate the debt away” stage of a long-term debt cycle beloved by Ray Dalio and as witnessed in the 1940s and the 1970s. Once total debt gets so high relative to economic output, financial repression becomes inevitable. In a period of financial repression, tightening to any significant degree will quickly result in recession and falling tax revenue.
Curve Inversion & Rates
The 10yr-2year Treasury curve has firmly inverted, and the 10yr-3mo yield curve is catching it:
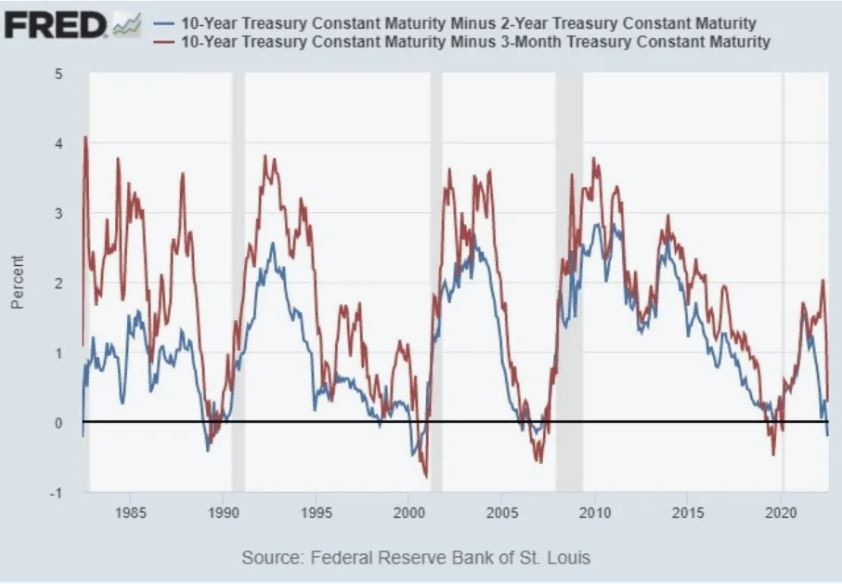
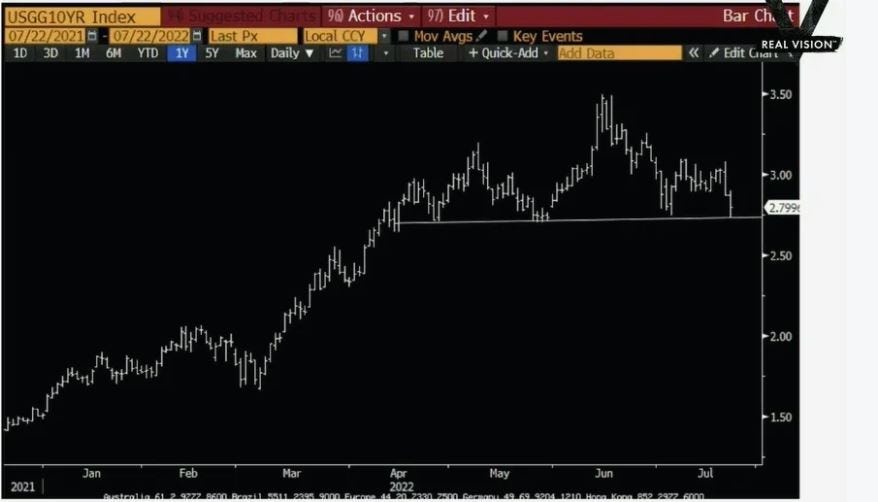
The Fed will likely raise rates by 75 basis points next week, increasing the policy rate to 2.25%. Another 50 basis points during their September meeting, followed by 25 basis points during their November meeting will imply rates top out at around 3% by the year end. Hiking to 3% or a bit higher is still well below the inflation rate, but with so much debt in the system and a recession forming, it is hard to imagine the Fed pushing beyond that point. Particualrly when there is a mid-term election in November. The US 10 yr yield pattern indicates we have passed the peak of long-term rates and could break down towards 2.5% soon.
Meanwhile In Europe
Europe as a whole is in worse economic and financial shape than the US. An ECB rate rise of 50 bps last week was more than expected, but the policy rate is still more than 8% below prevailing inflation and remains significantly below USD rates. USD strength, such a feature year to date, could continue for some time.
Yield Curve Control for Italy
The ECB also launched its TPI tool to permit the monetisation of Italian sovereign debt, effectively imposing yield curve control on Italian bonds. Arguably consigning Italy to become the Japan of Europe. Italy’s working-age population is shrinking, and other unresolved structural issues make it nearly impossible for the country to grow out of its 150% debt-to-GDP problem. On cue, as the ECB was in mid policy update mode, Italy’s Prime Minister of the past 11 months, Mario Draghi, resigned, highlighting this local difficulty with significant pan-European ramifications.
European Checkmate
Europe is stuck in checkmate with southern European debt monetisation in a period of high inflation and a worrying energy security problem. Volatile and elevated energy prices make it almost impossible to manufacture in Europe competitively. As we head towards winter, it remains unclear to what extent Russia might leverage the supply of its natural gas exports to extract geopolitical concessions from European. The recent resumption of gas supply via the Nordstream I pipeline and the agreement to allow grain exports from Odessa might indicate a softening line. It is premature to know and a critical factor to monitor. This set-up is proving challenging for EU politics as EU member states and Brussels work to bring on additional power sources and gas supplies where possible and agree how to share the pain of shortages that arise. However, weaker economic data and a softening of the Russian-Ukrainian conflict would undoubtedly sharply lower oil prices, undermining the strongest performing equity market sector year to date.
UK Navel Gazing
The UK is involved in a period of internal Conservative Party navel-gazing, somewhat oblivious to the broader geopolitical environment or even their chosen candidate’s ability to win a popular mandate. While the UK has a more secure and diverse energy supply than most of the EU, it remains connected to the broader European energy market. Its connectivity includes acting as an LNG entrepot for Germany and outsourcing its gas storage to the Netherlands. If Europe suffers this winter, there will be knock on implications for the UK. By comparison the main political debate between Reaganite unfunded tax cuts or Thatcherite funded and delayed tax cuts is an anachronistic sideline.
The Bull & Bear Case
The bull case is that many stocks have already fallen substantially and sentiment is bearish. Everyone now expects a recession, and institutions are underweight equities and other risk assets. Long-term interest rates are no longer going up, removing a major valuation headwind for equities and bears could be caught offside if company earnings prove resilient. Long bonds yielding nearly 3% look like a decent medium-term bet. The bearish case for equities is that as the recession hits, the earnings of many companies disappoint. As the Fed has only just started quantitative tightening, there could be more downside. From that perspective, we are now seeing a bear market rally before a deep recession brings down asset prices, potentially much further.
Conculding Thoughts
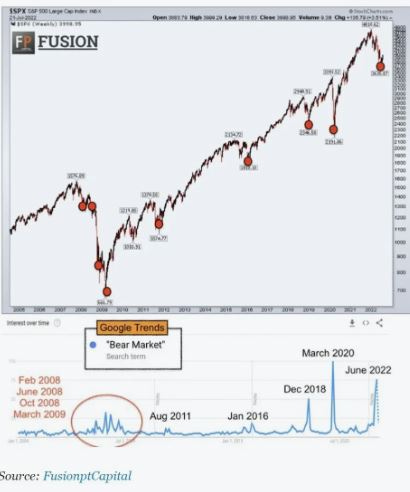
It is reasonable to expect a choppy and rangebound market for several months. Risk assets will remain volatile as uncertainty and illiquidity at both macro and micro levels remain heightened. One interesting and supportive chart is below from Fusion Capital. They look at the covariance of the S&P 500 with Google trends for searches of the term “Bear Market”. It would appear to be a very good contrary indicator, and one that is at its most positive since March 2020.
Jeremy
Ealing
The post OMG, We’ve Broken the Economy, but it might be OK. appeared first on Progressive.

